About the Account summary page
The Account summary page provides an overview of your service performance metrics and system health. This main dashboard displays key operational data to help you monitor and analyze your service usage patterns.
Before you begin
Be sure you know how to access the web interface controls before learning about the details you'll encounter here.
About the Account summary information
At the top of the page, a series of charts summarize the weekly trends across your account and services. Specifically:
- Requests: shows the total number of CDN and Compute requests aggregated across your account, helping you understand traffic volume and growth trends.
- Bandwidth: displays the total amount of bandwidth served across all services in your account.
- Error Ratio: presents the average ratio of error responses (4XX & 5XX) to total requests across your account, providing insight into service reliability.
Above these charts, summary cards display current performance indicators alongside trend analysis:
- Current week total: the aggregated value for the current week, providing a snapshot of recent activity levels.
- Last 7 day change: the percentage change of the current week's performance compared to the previous week, to help you identify whether metrics are trending up or down.
You can use these charts and summary cards to track request patterns and identify peak usage periods, monitor bandwidth consumption over time, analyze error rate fluctuations and performance issues, and compare current week performance (the solid line indicator in each chart) against the previous week (the dashed line indicator in each chart).
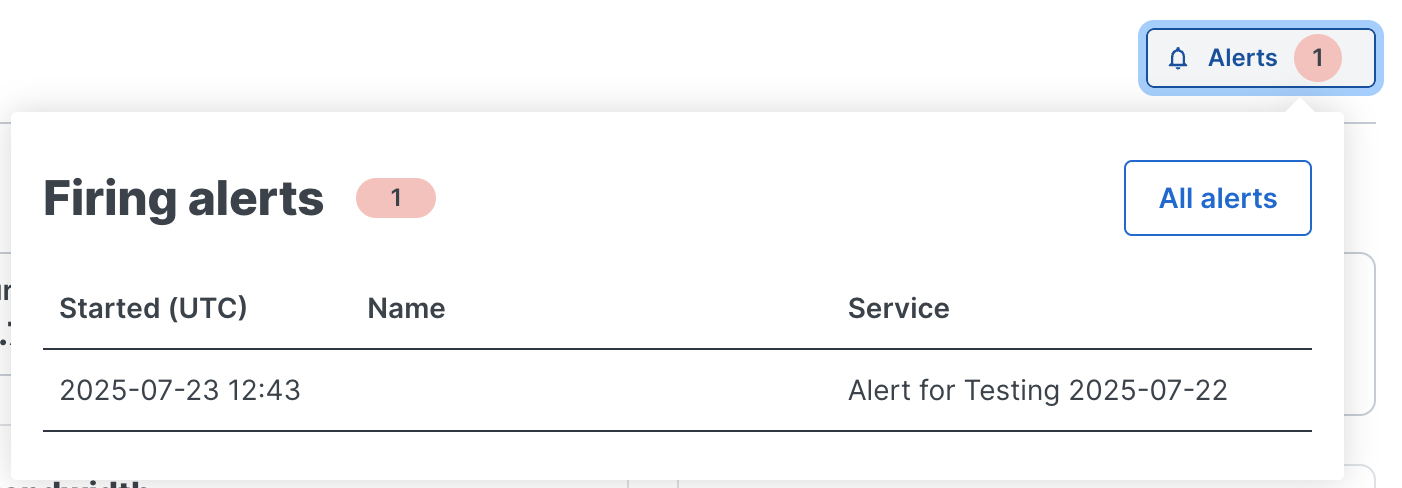
Hovering over the Active Alerts link above the summary cards displays a list of any active alerts associated with your account as well as a link that will take you to the alerts page where you can review them in detail.

About the Latest Alerts and Custom Dashboards areas
The bottom of the Account summary page provides a centralized way for you to view a list of the most recent:
- alerts defined for services on your account
- custom dashboards
Each of these areas provide a linked name of the alert or dashboard configured and the dates associated with them. They also provide direct links to all alerts and dashboards associated with your account.
TIP: Need to see aggregated metrics for all your services? Click the All services link above the Alerts and Custom Dashboards to go directly there.